


Prev.
Glassnode the much looked upon market analysis firm presented its on-chain data showing HODLing levels of Bitcoin. According to the insights it presented, the HODLing activity has seen a major upsurge to levels that have not been witnessed before. Circulating Bitcoins that were moving more at a snail’s pace in two years reached 8 million which suggests that users are keeping and holding Bitcoin for a longer outlook rather than short-term trading.
Why Bitcoin shines
We have already seen the Bitcoin halving event take place this year. The event which takes place once every 4 years halves the amount of Bitcoin rewarded to miners upon mining a block. This apparently slows the pace at which BTC reaches its maximum supply of 21 million. Bitcoin shines mainly because of its scarcity but we cannot rule out that it is a promising store of value with fungibility and portability benefits. With events such as halving the scarcity factor increases which works in favor of Bitcoin leading to long-term bull markets and short-term bullish trends. Take the case of the last halving event which took place in 2016. At that time, Bitcoin was priced at around $663 on Bitstamp and within 15 months of the halving Bitcoin surged to $19891 which is a huge 2,820% gain.
Increase in HODLing
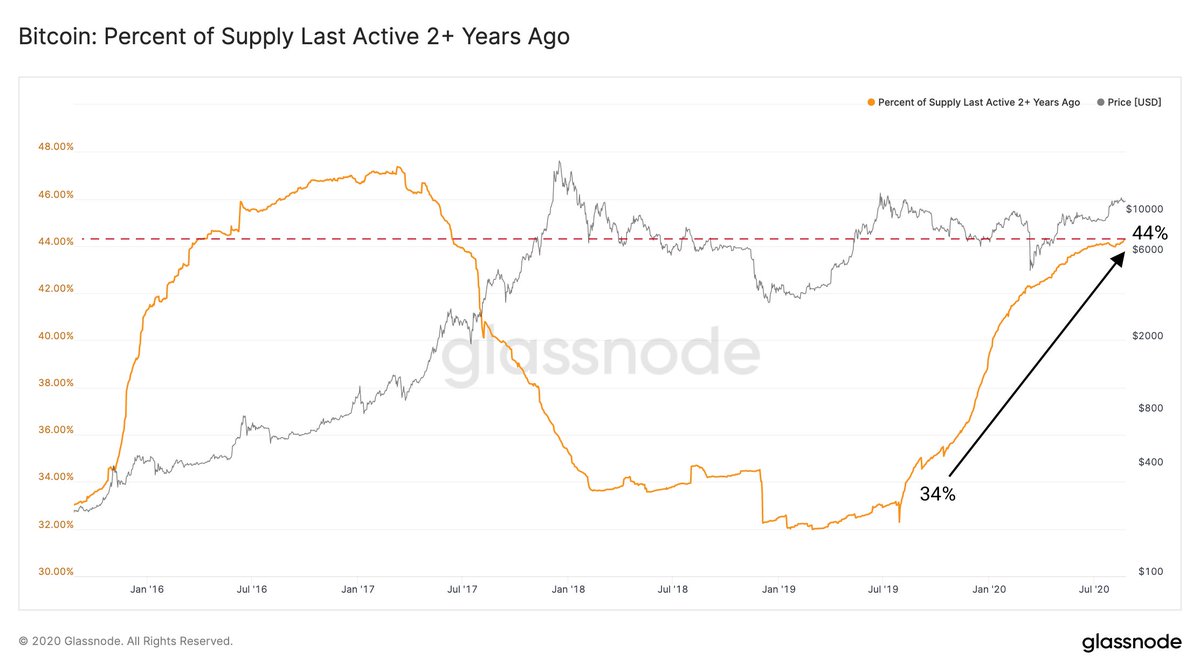
The increase in HODLing of Bitcoin by a huge number of addresses follows the third block reward halving event on May 11th. People have been watching trends and historical data and based on that they might be accumulating bitcoin waiting to pounce on big gains. The researchers at Glassnode observed that Increased Bitcoin investor HODLing activity has been fruitful for BTC. The circulating supply which hasn’t moved in 2 years is now at 44%(8M BTC) which has not been observed in the last 3 years. Look at the chart below and see the % of addresses increase by 44% in less than 2 months.
HODL wave also is anothe metric that shows the growing HODLing behavior. Cryptowatch, the crypto data provider also confirmed it. HODL wave is an on-chain indicator that was created by LookIntoBitcoin evaluating addresses that have not moved Bitcoin for more than a year.
HODLing emulating 2016 run!
Now another thing to note here is that the HODLing activity of Bitcoin is clearly not directly proportional to its weekly price trends. If we go back to 2016 and observe investor behavior we can notice a striking similarity here. Throughout 2016, before the Bitcoin rally to its all-time high in December 2017, the number of HODLing addresses increased. After this, the addresses automatically declined after it recorded a high falling from around 40% to less than 34% of all addresses indicating sell-offs. Now that this trend seems to be emulating the 2016 cycle, it could be that the investors are anticipating a new Bitcoin uptrend but not for the shorter period. Looks like investors are more bound to save it up for long term for record-breaking profits.